Measuring Performance with PStats

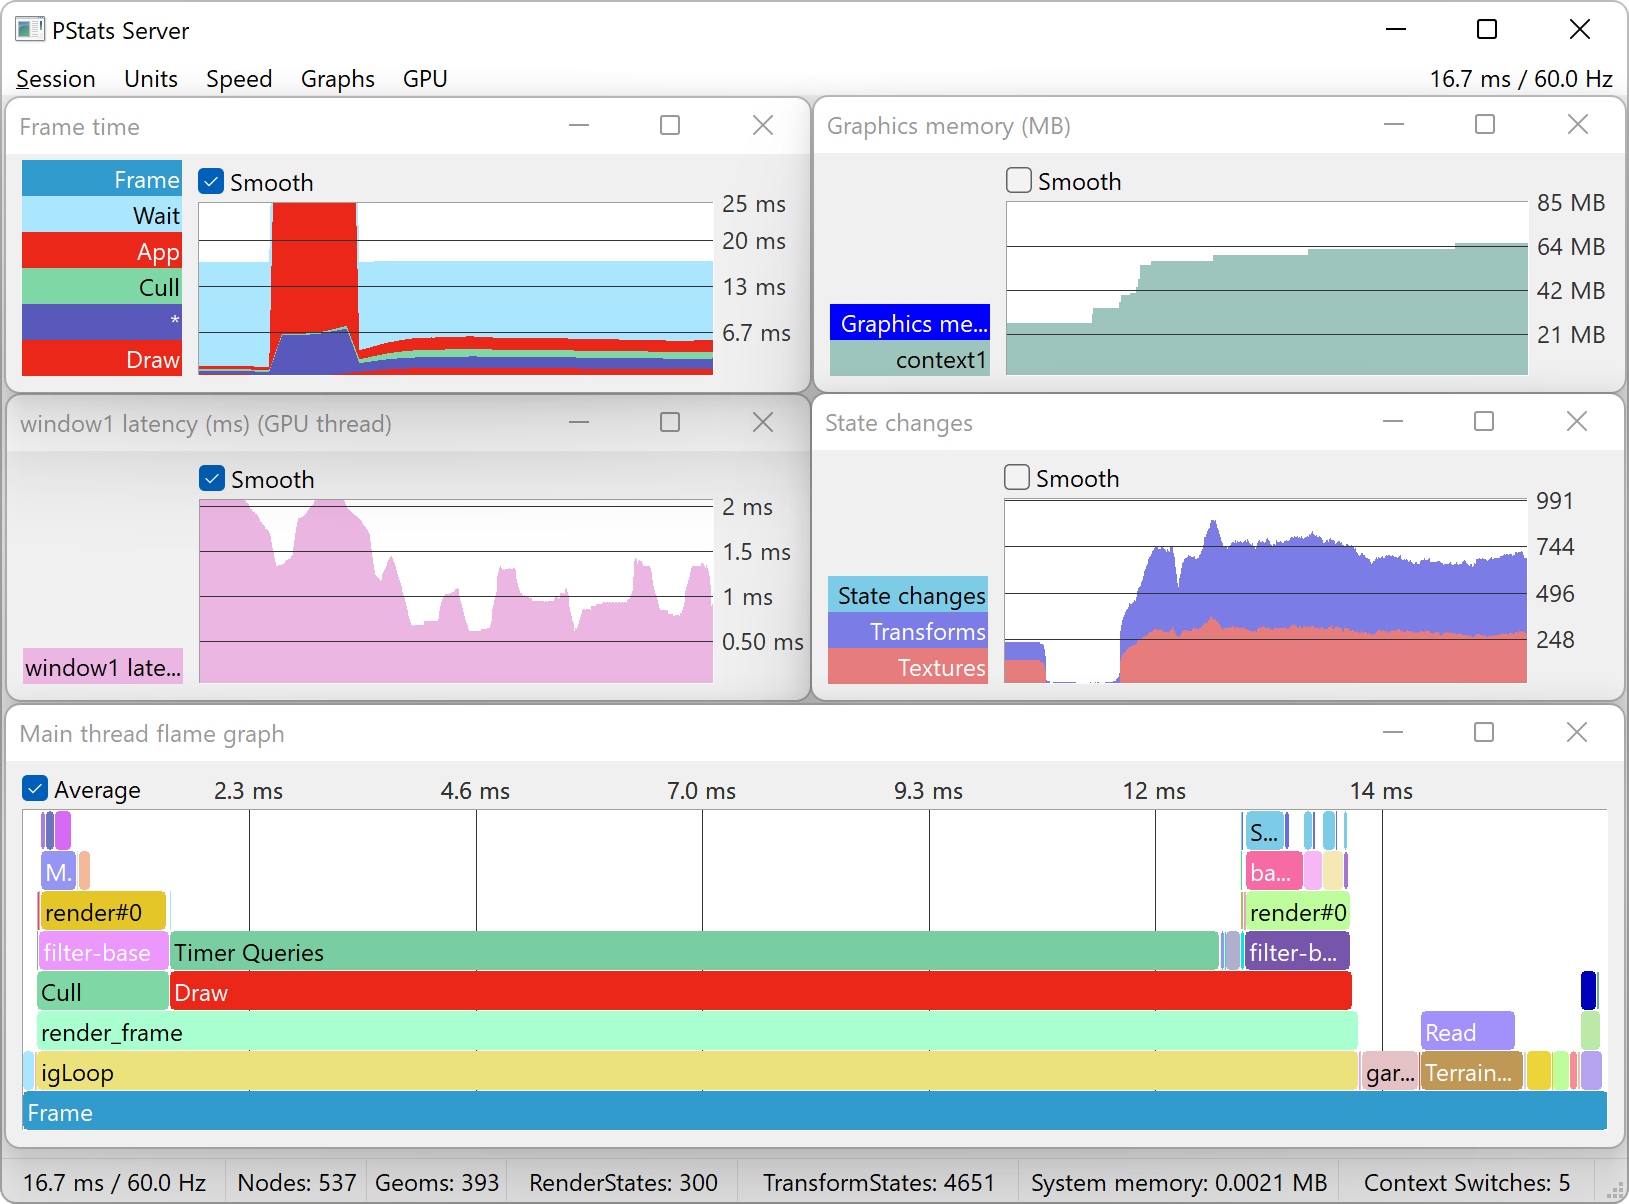
PStats is Panda’s built-in performance analysis tool. It can graph frame rate over time, and can further graph the work spent within each frame into user-defined subdivisions of the frame (for instance, App, Cull and Draw), and thus can be an invaluable tool in identifying performance bottlenecks. It can also show frame-based data that reflects any arbitrary quantity other than time intervals, for instance, texture memory in use or number of vertices drawn.
PStats consists of two parts: the server program, which is a separate utility shipped with the Panda3D installation and is responsible for drawing the graphs, and the client, which is part of the Panda3D library. The server utility may be run on the same computer that is running the Panda client, or it may be run on another computer on the same LAN, which is useful for analyzing fullscreen applications. The remote computer need not be running the same operating system or even the same Panda3D version as the client computer.
It is furthermore possible to save the recorded performance data to a file and open it for analysis at a later date, or to export the data in JSON format for inspection in external tools, such as Chrome Tracing or Perfetto.
To use PStats, simply run the pstats.exe server utility and connect a Panda3D application to it, as described here.
Note
On macOS, the PStats server utility is not included with the installation, but it can be built from source if the GTK+ 3 library is available on the system. Alternatively, it is possible to connect over the network to a different computer that does have the PStats server utility available.
