Basic Profiling
Enabling PStats
To use PStats, you first need to run the PStats server program, which is part of the Panda3D installation on Windows and Linux. On macOS, it is not included, but it can be built from source if the GTK+ 3 library is available on the system.
Once it is running, launch your application with the following added to your start-up code:
// Includes: pStatClient.h

if (PStatClient::is_connected()) {
  PStatClient::disconnect();
}

string host = ""; // Empty = default config var value
int port = -1; // -1 = default config var value
if (!PStatClient::connect(host, port)) {
  std::cout << "Could not connect to PStat server." << std::endl;
}
Or if you’re running pview, press shift-S.
Any of the above will contact your running PStats server program, which will proceed to open a window and start a running graph of your client’s performance.
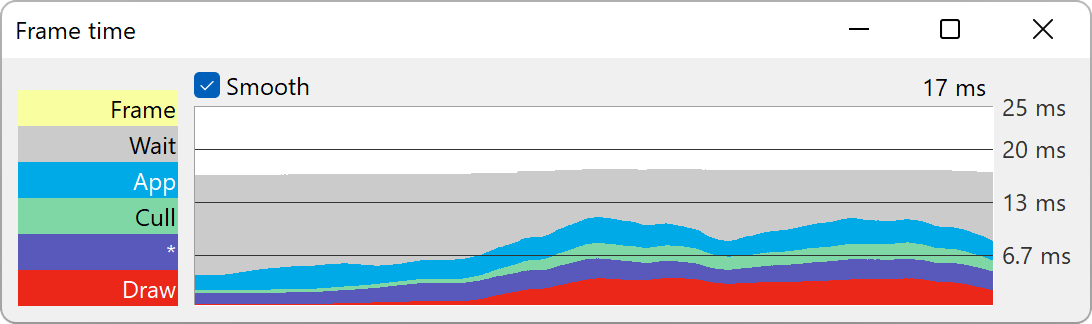
By default, Panda3D will open a single Strip Chart showing a progression of the frame rate over time. Double-click the collector labels on the left side to narrow down the view to sub-divisions of the collectors, or use the Graphs menu in the menu bar to create additional graph windows. It is worth learning about the various graph types and how to interact with them before proceeding.
Once you are done recording the profiling data, you can close the application. The PStats server interface will remain open, giving you a chance to further analyze the data or save it to disk. You need to close the existing session and click “New Session” before you can reconnect a new client.
Profiling Python Code
If you are developing Python code, you may be interested in reporting the relative time spent within each Python task (by subdividing the total time spent in Python code, as reported under “App:Tasks”). To do this, add the following line to your Config.prc file before you start ShowBase:
pstats-tasks 1
However, it can be even more useful to enable the Python profiler feature, which collects detailed information about the individual function calls made by the Python interpreter. There is a performance cost to this feature, which is why it is not enabled by default. To enable it, use the following setting:
pstats-python-profiler 1
To get a hierarchical breakdown of the time taken by a particular Python module, class or function, use the Strip Chart view and double-click the App, then the Python label on the left side. Then, you can drill down into the specific Python packages, modules and functions:
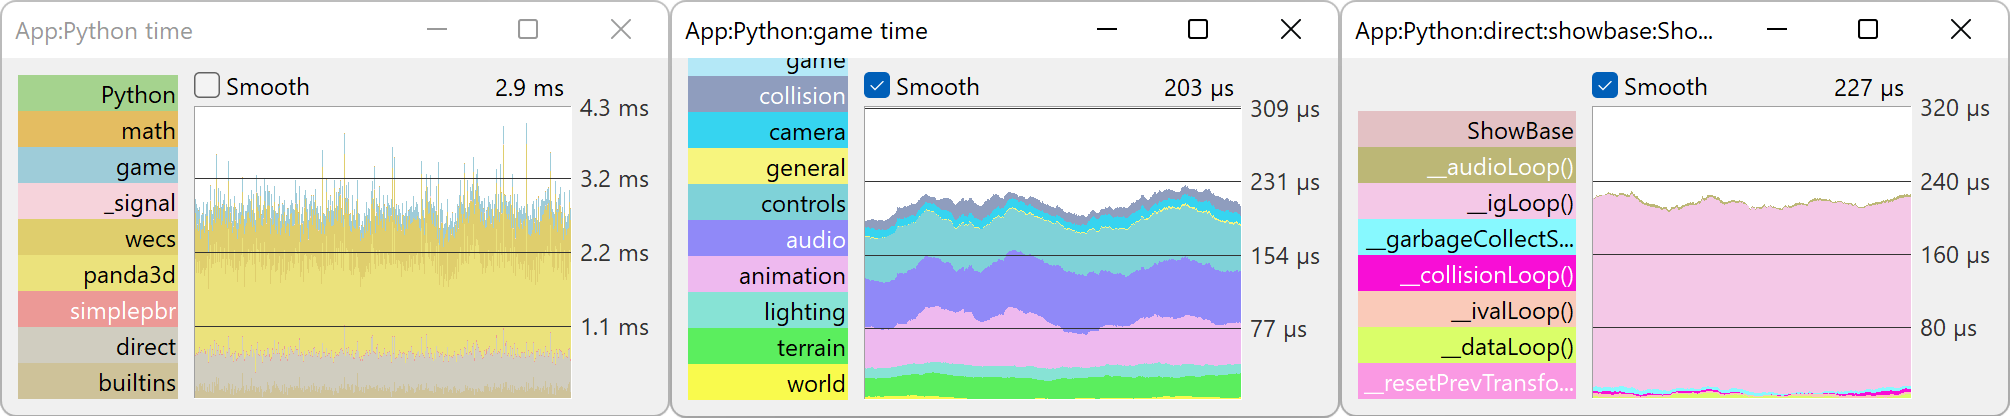
The time-based strip charts just collect the total time spent executing a particular function, without any information about what other functions a particular function is calling or is called by. Use the Flame Graph view to see call graph information:
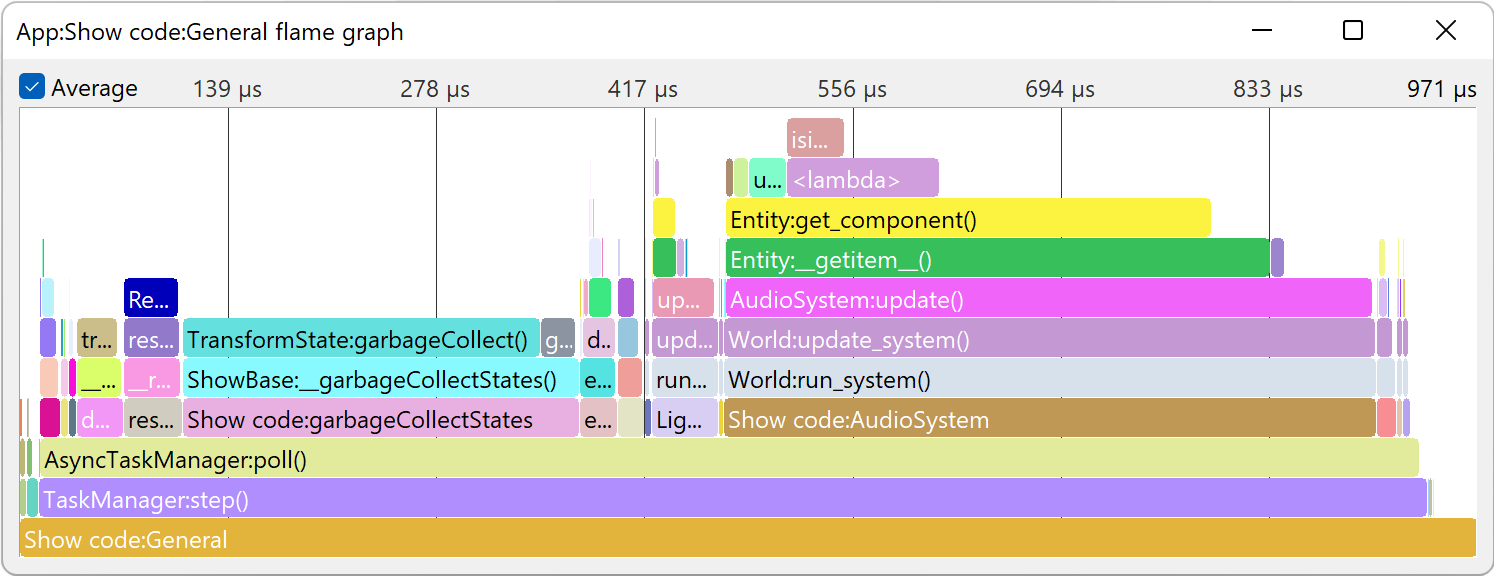
You can hover the mouse over the individual bars to see the full name, exact time and call count of the given function within its parent scope. Double-clicking a bar will narrow down the view to only that function and any functions called by it, and double-clicking the white space will go back.
Remote Profiling
If you have multiple computers available for development, it can be advantageous to run the pstats server on a separate computer so that the processing time needed to maintain and update the pstats user interface isn’t taken from the program you are profiling. If you wish to run the server on a different machine than the client, start the server on the profiling machine and add the following variable to your client’s Config.prc file, naming the hostname or IP address of the profiling machine:
pstats-host profiling-machine-ip-or-hostname
pstats-port 5185
By default, the port number used by PStats is 5185. It can be changed by using
the pstats-port variable, as shown above.
Session Files
At any point, it is possible to save the currently displayed data to a file on disk. This makes it possible for the profiling data to be analyzed at a later date, or be shared with others for collaborative analysis.
Use the “Save Session” menu item to store the recorded data in a session file. At any point, you can launch the PStats server (without a connected client) and use “Open Session” to review the recorded data.
The PStats Server also automatically stores the last recorded session to a file
in the Panda3D cache directory called last-session.pstats. If you close the
PStats Server by accident without saving the session file to disk, you can start
PStats and use the “Open Last Session” menu option to restore this data.
Exporting to JSON
To export the timing information to a format that can be read by other applications, the “Export to JSON” menu option can be used. The format of this file is the Trace Event Format. This can be read by a variety of tools, including the Chrome Tracing tool and the online Perfetto application.
It is also possible to use this feature if no graphical PStats server is
available. To do this, use the text-stats utility like so:
text-stats -j -o output.json